Execution Gaps in Public-Mempool Uniswap V3 Swaps: When Slippage Tolerance Becomes the Realized Execution Price
Abstract
Decentralized exchange users authorize swaps based on simulated market outcomes computed from current liquidity, prices, and routing conditions. Between simulation and inclusion, execution conditions remain dynamic: markets and prices move, liquidity changes, and transaction ordering alters settlement. We refer to the difference between the pre-inclusion simulated execution outcome, which already includes the user's own swap price impact, and the realized onchain settlement outcome as the execution gap.
Slippage tolerance defines the worst outcome a user authorizes before execution reverts. It does not guarantee the simulated outcome; it only establishes an acceptable lower bound on settlement.
In this study we measure execution gaps across large public-mempool Uniswap V3 swaps on Ethereum mainnet. Within the default-tolerance range commonly used across transaction interfaces and wallet software, outcomes concentrate near the signed execution floor: 64.0% of these swaps settled within 1% of the floor (equivalently, ≥99% of the slippage budget consumed); 48.6% landed within 0.1% of the floor.
Realized execution outcomes are strongly asymmetric toward adverse execution relative to the signing-time counterfactual V₀. Only 26 of 332 swaps (7.8%) settled favorably, producing aggregate gains of approximately $102 against $223 865 of cohort-wide execution shortfall over a 90-day period.
The loose-tolerance subcohort exhibits a different outcome structure. Among swaps signed above 200 basis points (median: 5 025 bps), 93.5% still settled below V₀. Relative to the default-tolerance population, outcomes in this subcohort concentrate away from the signed execution floor and distribute across the interior of the authorized range.
Measurements cover a 90-day Ethereum mainnet cohort of 332 public-mempool Uniswap V3 swaps above $50 000 notional. Sensitivity analysis excluding swaps touching unusual activity periods strengthens rather than weakens the principal findings, suggesting that these periods diluted rather than created the observed concentration structure.
TL;DR
- Within the default-tolerance range commonly used across transaction interfaces and wallet software, outcomes concentrate near the signed execution floor. Of the 286 swaps signed with tolerance ≤ 200 bps (median 50 bps), 64.0% settled within 1% of the floor and 68.5% within 5%.
- Realized outcomes are usually worse than the signing-time simulation. Only 26 of 332 swaps (7.8%) settled favorably, while 265 (79.8%) settled adversely. Aggregate gains totaled $102 versus $223 865 of cohort-wide execution shortfall over 90 days. The largest favorable outcome measured only +3 bps relative to V₀.
- Trade size has limited impact on execution degradation. Across notional buckets $50k–$100k, $100k–$200k, and ≥$200k, the share of swaps with
budget_consumed ≥ 0.95remains approximately constant at 59%. - The loose-tolerance subcohort does not cluster at the floor, but adverse execution remains common. None of these swaps settled within 5% of the signed execution floor, yet 93.5% still settled below V₀. Outcomes appear distributed away from the floor relative to the default-tolerance population.
- The findings strengthen after excluding swaps touching pools with unusual activity periods. Default-tolerance floor concentration increases from 64.0% to 78.3%, and the adverse-outcome share rises from 79.8% to 87.0%, suggesting these periods diluted rather than created the observed effect.
The largest observed execution shortfall reached $5 757 on a $1.30M ETH→USDC swap that settled exactly at its signed execution floor.
Contents
- Introduction
- Findings
- Interpretation and conclusion
- Methodology
- Limitations
- Future work
- Reproducibility
- Appendix A: Notation and formulas
- Appendix B: Flagged pair inventory and unusual-activity context
1. Introduction
When users swap assets on a decentralized exchange, the interface they use, such as a wallet, DEX frontend, or trading application, presents a simulated market outcome: an estimate of the amount of tokens expected from the transaction under current on-chain conditions. Users then sign a slippage tolerance, which defines the minimum acceptable output before the transaction reverts.
At signing time, users authorize code execution rather than a precisely known economic outcome. They sign transaction logic and a slippage boundary; the final economic result is determined later by market conditions and transaction ordering. Between signing and inclusion, prices move, liquidity changes, other participants interact with the same pools, and strategic activity may alter market conditions. The simulated outcome therefore represents an estimate of potential settlement rather than a guaranteed result, while slippage tolerance defines only an execution boundary.
Prior work on MEV and transaction ordering has largely focused on specific mechanisms, such as sandwiching, arbitrage, liquidation ordering, and searcher or builder behavior. This paper asks a different question: regardless of which mechanism produced the movement, what distribution of execution outcomes does the user actually experience after signing a transaction routed through the public mempool?
Across a sampled transaction cohort, how do all sources of execution degradation collectively shape realized execution? This paper measures that question empirically and characterizes the resulting execution-gap distributions.
Note: The execution gap is not the user's own initial swap price impact. The simulated baseline V₀ already includes the route, liquidity, pool fees, and price impact of executing the user's exact transaction against the pre-inclusion pool state. The measured gap captures additional deterioration between that simulated execution and final onchain settlement.
2. Findings
2.1 Primary distribution findings
Two findings define the headline structure of the cohort. Within the default-tolerance subcohort, realized outcomes concentrate near the signed execution floor (§2.1.1). Across the full cohort, favorable outcomes are rare in both frequency and aggregate magnitude (§2.1.2).
2.1.1 Execution outcomes concentrate near the signed execution floor
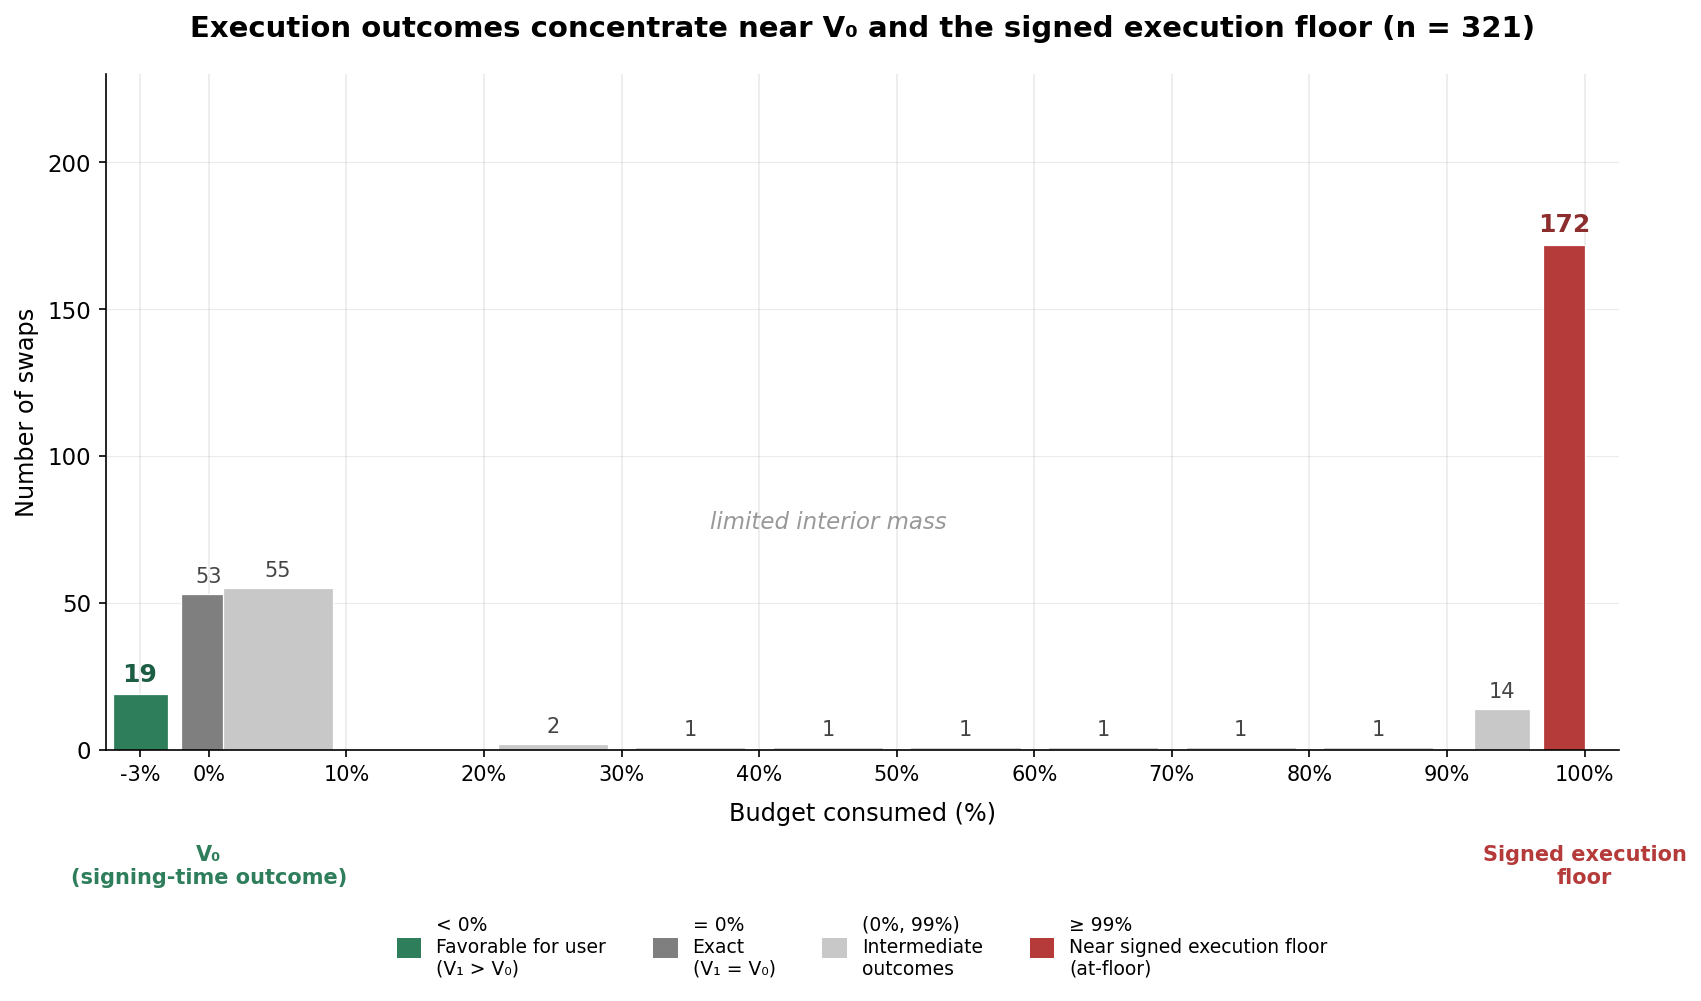
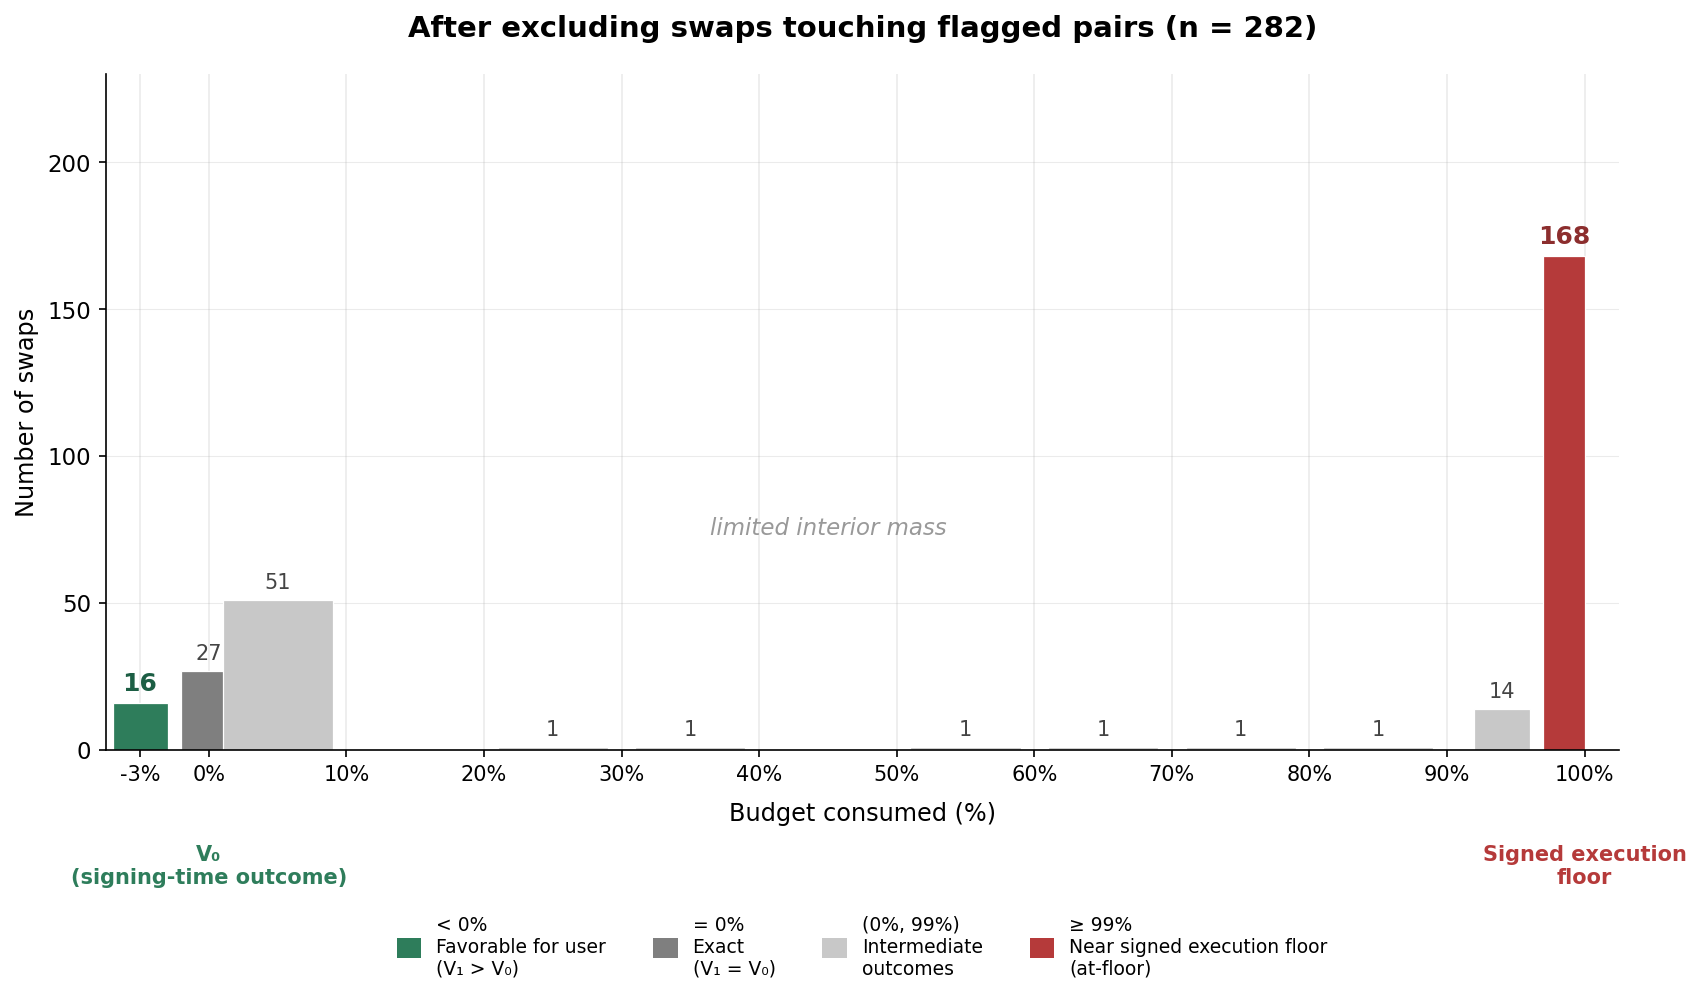
Within the default-tolerance subcohort, the dominant concentration is near the signed execution floor. A smaller second concentration appears near the signing-time counterfactual V₀, while comparatively little mass lies between these two regions. Figure 2.1.1 visualizes this distribution.
Throughout this section, budget_consumed measures how much of the user's authorized slippage range is ultimately used during execution. A value near 100% indicates settlement close to the signed execution floor; a value near 0% indicates settlement close to the simulated outcome visible at signing time (Section 4.5, Appendix A).
To summarize the distribution, we group outcomes by proximity to the user's signed execution floor. At-floor refers to swaps with budget_consumed ≥ 0.99, meaning execution settled effectively at the signed execution floor. Near-floor refers to swaps with budget_consumed ≥ 0.95, which includes both the at-floor mass and outcomes settling within 5% of the signed execution floor. The exact-or-favorable category corresponds to V₁ ≥ V₀, meaning execution was either equal to or better than the signing-time simulation.
Table 2.1.1a reports the empirical density of budget_consumed across the default-tolerance subcohort and the full analyzed cohort.
Table 2.1.1a: Empirical density of budget_consumed. Each row is a half-open range. Cells are count followed by within-subcohort share.
| Range of budget_consumed | Default-tolerance (n = 286) | Full analyzed cohort (n = 332) |
|---|---|---|
| budget_consumed < 0 (favorable: V₁ better than V₀) | 22 (7.7%) | 23 (6.9%) |
| budget_consumed = 0 (exact: V₁ ≈ V₀) | 42 (14.7%) | 45 (13.6%) |
| 0 < budget_consumed < 0.50 | 21 (7.3%) | 63 (19.0%) |
| 0.50 ≤ budget_consumed < 0.90 | 4 (1.4%) | 4 (1.2%) |
| 0.90 ≤ budget_consumed < 0.99 | 14 (4.9%) | 14 (4.2%) |
| 0.99 ≤ budget_consumed ≤ 1.00 (within 1% of the signed execution floor) | 183 (64.0%) | 183 (55.1%) |
Within the default-tolerance subcohort, only 18 swaps (6.3%) fall in the intermediate band 0.50 ≤ budget_consumed < 0.99. By contrast, 64 swaps (22.4%) lie in the exact-or-favorable region (budget_consumed ≤ 0) and 183 swaps (64.0%) settle within 1% of the signed execution floor (budget_consumed ≥ 0.99). The distribution therefore forms two dominant concentrations with comparatively little interior mass.
Table 2.1.1b reports cumulative threshold shares.
Table 2.1.1b: Share of each cohort with budget_consumed at least a given threshold τ. Each cell is the within-subcohort share followed by the count in parentheses.
| Threshold τ | Default-tolerance (n = 286) | Full analyzed cohort (n = 332) |
|---|---|---|
| 0.999 (within 0.1% of the signed execution floor) | 48.6% (139) | 41.9% (139) |
| 0.99 (within 1%) | 64.0% (183) | 55.1% (183) |
| 0.95 (within 5%) | 68.5% (196) | 59.0% (196) |
| 0.80 (within 20%) | 69.2% (198) | 59.6% (198) |
The threshold transition is abrupt. Increasing the threshold from τ = 0.80 to τ = 0.95 changes the default-tolerance share by less than one percentage point. Conditional on a swap consuming at least 80% of its authorized slippage range, settlement near the signed execution floor becomes highly probable.
The principal finding reported throughout the article uses the stricter threshold budget_consumed ≥ 0.99, corresponding to settlement within 1% of the signed execution floor. The broader τ = 0.95 threshold is included as a robustness check.
Counts in Table 2.1.1a use the float-precision budget_consumed value emitted by the pipeline. This can differ slightly from the raw wei-exact V₁ = V₀ count in Table 2.1.2.
2.1.2 Adverse outcomes dominate favorable outcomes
Before measuring how much of the authorized slippage range is consumed, a simpler question is whether realized execution falls above or below the signing-time counterfactual V₀. Table 2.1.2 reports favorable (V₁ > V₀), exact (V₁ = V₀), and adverse (V₁ < V₀) outcomes.
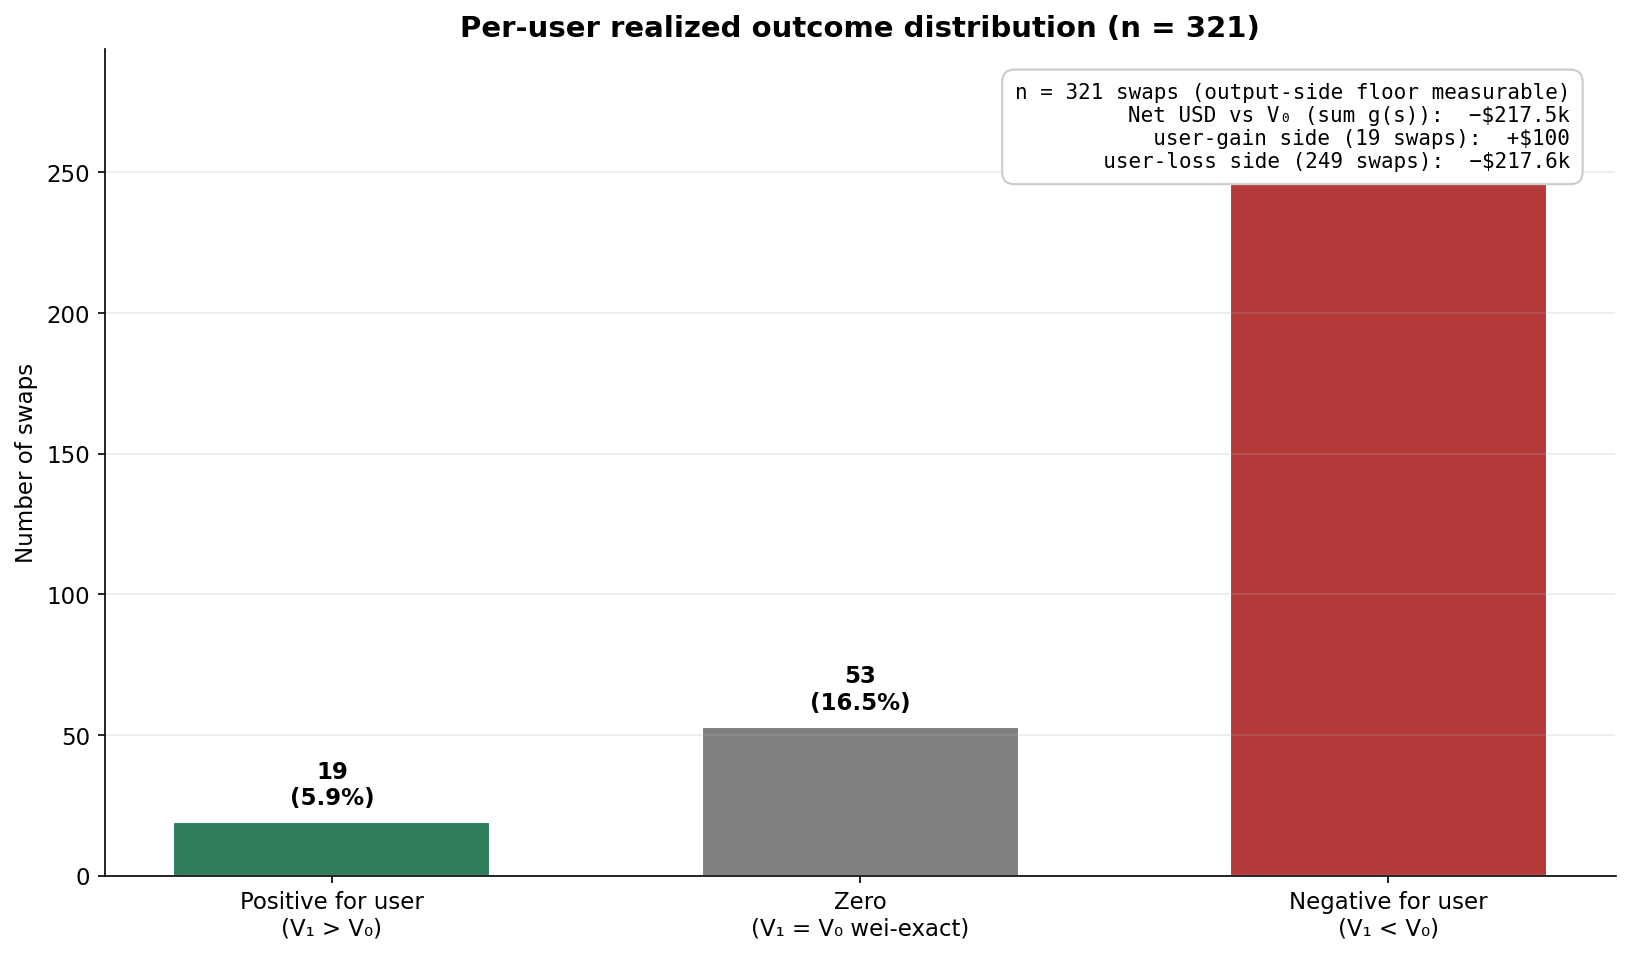
Table 2.1.2: Per-user realized outcome distribution. Counts and within-cohort shares for the full analyzed cohort and the default-tolerance subcohort.
| Outcome for the user | Condition | Full analyzed cohort (n = 332) | Default-tolerance subcohort (n = 286) |
|---|---|---|---|
| Favorable (V₁ better than V₀) | V₁ exceeds V₀ on the user's side | 26 (7.8%) | 25 (8.7%) |
| Exact (V₁ = V₀ wei-exact) | V₁ = V₀ | 41 (12.3%) | 39 (13.6%) |
| Adverse (V₁ worse than V₀) | V₁ falls short of V₀ on the user's side | 265 (79.8%) | 222 (77.6%) |
Across the full cohort, only 26 of 332 swaps (7.8%) settled favorably relative to V₀, while 265 (79.8%) settled adversely. Exact outcomes account for the remaining 41 swaps (12.3%). The distribution is therefore highly asymmetric, with adverse outcomes outnumbering favorable outcomes by roughly 10 to 1.
The exact-outcome population is not uniformly distributed. A substantial fraction (20 of 41 wei-exact swaps, 48.8%) routes through the Aave-receipt paths discussed in Sections 4.7 and 2.3.
Favorable outcomes are small in both frequency and aggregate magnitude. Favorable outcomes contribute approximately +$102 across the cohort, compared with approximately −$224 000 of execution shortfall on the adverse side.
2.1.3 The signed execution floor is approached more often than crossed
The successful-swap cohort is necessarily censored at the signed execution floor. If an exact-in swap would receive less than amountOutMinimum, or an exact-out swap would require more than amountInMaximum, the transaction reverts and does not appear in the V₀/V₁ distribution.
This matters because floor concentration could have two different explanations. One possibility is that many swaps try to cross the floor and fail, leaving only a thin visible edge of successful swaps just inside the boundary. Another possibility is that the dominant pattern is successful execution very close to the boundary, with only a smaller reverted population beyond it.
A companion attempt-level measurement over the same observation window, public-mempool scope, direct-router scope, and $50 000 notional threshold estimates slippage-induced reverts at approximately 4.2% of attempts. This measurement is not computed on the exact 332-swap reconstructed cohort, which contains only successful swaps with V₀/V₁ outcomes, but it is drawn from the same scoped transaction population before reconstruction and success filtering.
The contrast is informative. In the analyzed successful cohort, 64.0% of default-tolerance swaps settle within 1% of the signed execution floor, while the same-scope attempt-level measurement suggests that only a small fraction of attempts cross the boundary and revert for slippage reasons. The dominant observed pattern is therefore not mass failure beyond the floor, but successful execution concentrated just inside it.
2.2 Secondary structure
Beyond the headline distribution, three patterns further characterize the cohort: outcome structure differs across signed tolerance ranges (§2.2.1), the at-floor concentration is largely invariant to trade size (§2.2.2), and aggregate execution shortfall concentrates in the default-tolerance range (§2.2.3).
2.2.1 Execution outcomes differ across tolerance ranges
The Section 4.6 tolerance-range partition divides the cohort into two ranges. Figure 2.2.1 shows how budget_consumed distributes within each.
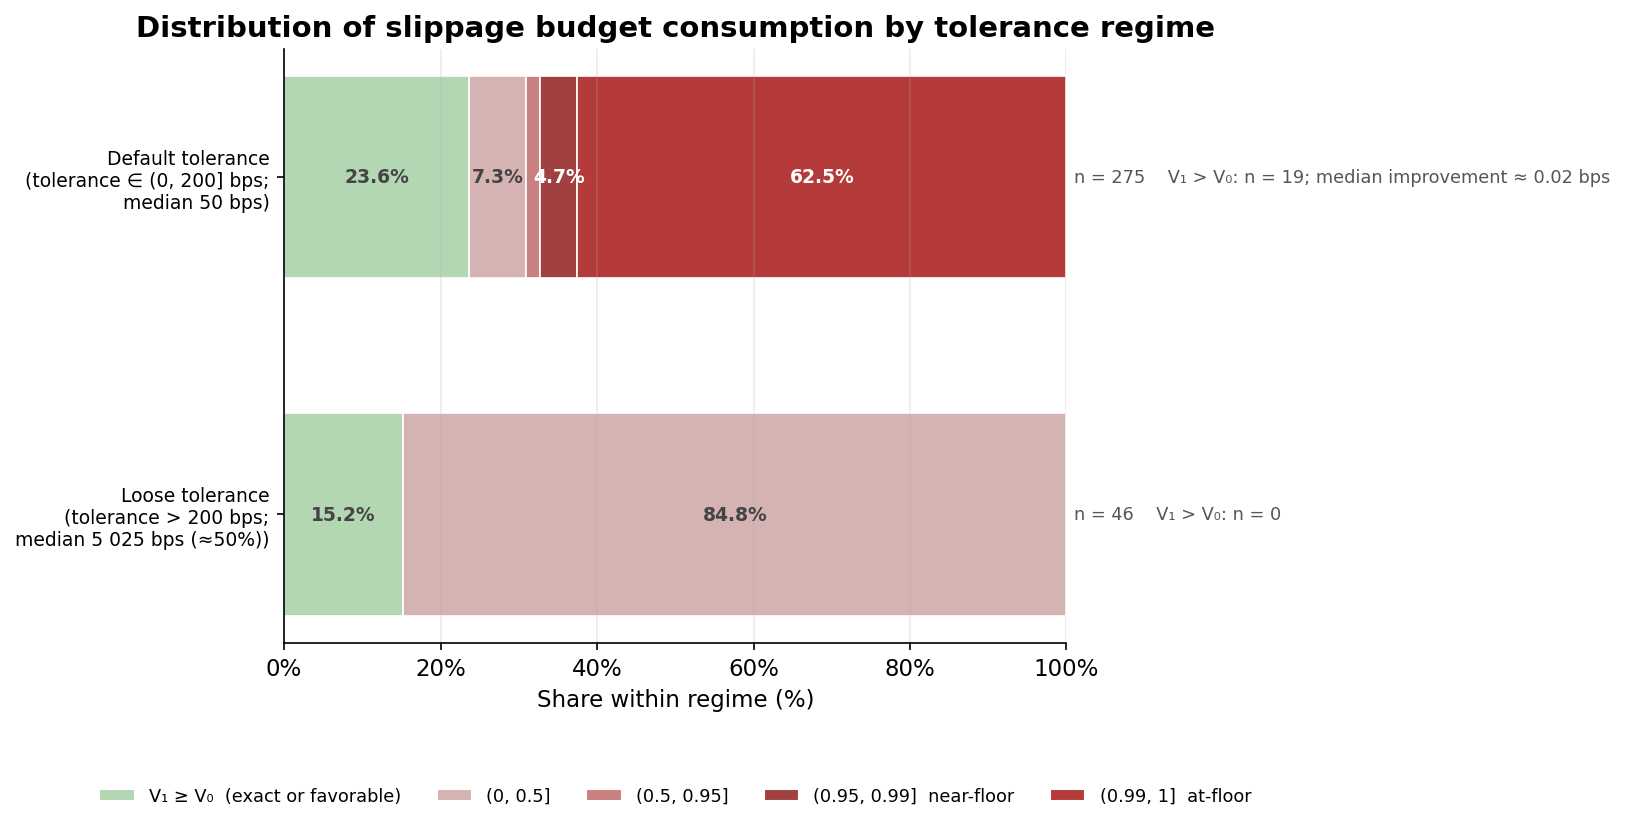
The two tolerance ranges exhibit different locations of concentration within the authorized slippage range, while adverse execution remains common in both.
Table 2.2.1: At-floor (budget_consumed ≥ 0.99), near-floor (budget_consumed ≥ 0.95), and exact-or-favorable (V₁ ≥ V₀) shares by tolerance range. Each row corresponds to a tolerance range defined in Section 4.6.
| Tolerance range | n | Share with budget_consumed ≥ 0.99 (at-floor) | Share with budget_consumed ≥ 0.95 (near-floor) | Share with budget_consumed ≤ 0 (exact-or-favorable) | Share with 0 < budget_consumed < 0.5 | Sum of g, USD | Mean g, USD per swap |
|---|---|---|---|---|---|---|---|
| Default tolerance (tolerance ≤ 200 bps; median 50 bps) | 286 | 64.0% (183) | 68.5% (196) | 22.4% (64) | 7.3% (21) | −$199 080 | −$696 |
| Loose tolerance (tolerance > 200 bps; median 5 025 bps ≈ 50%) | 46 | 0.0% (0) | 0.0% (0) | 8.7% (4) | 91.3% (42) | −$24 785 | −$539 |
| Full analyzed cohort | 332 | 55.1% (183) | 59.0% (196) | 20.5% (68) | 19.0% (63) | −$223 865 | −$674 |
The default-tolerance range corresponds to the slippage values commonly used by wallet and interface defaults. Within this tolerance range, the dominant outcome is settlement near the user's signed execution floor: 68.5% of default-tolerance swaps consume at least 95% of the authorized slippage budget. In the loose-tolerance range, the observed structure differs. No loose-tolerance swap settles within 5% of the floor, while 91.3% consume between 0% and 50% of the available budget. Across the 46 loose-tolerance swaps, realized adverse movement relative to V₀ remains bounded: median 44 bps, p90 49 bps, and maximum 95 bps under the symmetric metric defined in Appendix A.
Aggregate execution shortfall is also concentrated in the default-tolerance range. Swaps in this range account for $199 000 of the cohort-wide $224 000 execution shortfall (88.9%), corresponding to a mean shortfall of $696 per swap. Loose-tolerance swaps contribute $25 000 (11.1%), with a mean shortfall of $539 per swap.
Observed tolerance ranges correspond to different execution-outcome structures within the measured cohort. The present study does not establish whether tolerance itself, route composition, liquidity characteristics, or asset selection drive these differences.
2.2.2 Trade size does not materially change floor concentration
Across the cohort, at-floor concentration remains approximately constant across notional buckets.
Table 2.2.2: At-floor, near-floor, exact-or-favorable share by trade-notional bucket. Full analyzed cohort, partitioned by the swap's Dune dex.trades.amount_usd.
| Trade notional bucket | n | Share with budget_consumed ≥ 0.99 | Share with budget_consumed ≥ 0.95 | Share with budget_consumed ≤ 0 |
|---|---|---|---|---|
| $50k–$100k | 106 | 54.7% | 59.4% | 22.6% |
| $100k–$200k | 118 | 55.1% | 59.3% | 15.3% |
| ≥ $200k | 107 | 56.1% | 58.9% | 24.3% |
Across the three notional buckets, the share with budget_consumed ≥ 0.95 ranges from 58.9% to 59.4%, a spread of only 0.5 percentage points. In this cohort, concentration near the signed execution floor appears largely invariant to trade size. Absolute execution shortfall increases with notional, but the distribution of outcomes does not materially change.
2.2.3 Economic magnitude of execution shortfall
Table 2.2.3a: Aggregate USD realized output gap g by cohort. Columns name the cohort, count, total over the cohort, per-swap mean, and per-swap median of g. Sign convention: negative g = user-side execution shortfall (Appendix A).
| Cohort | n | Sum of g over cohort, USD | Mean g, USD per swap | Median g, USD per swap |
|---|---|---|---|---|
| Default-tolerance subcohort | 286 | −$199 080 | −$696 | −$426 |
| Full analyzed cohort | 332 | −$223 865 | −$674 | −$413 |
| Loose subcohort | 46 | −$24 785 | −$539 | −$260 |
The default-tolerance subcohort accounts for $199 080 of the cohort-wide $223 865 execution shortfall (88.9%), while representing 86.1% of analyzed swaps.
Aggregate favorable outcomes total approximately +$102 across the cohort, compared with $223 865 of execution shortfall on the adverse side.
Table 2.2.3b: The ten swaps with the most negative g in the full analyzed cohort. Ordered by ascending g. Columns name the rank, swap pair and V3 pool fee tier, trade notional, the swap's budget_consumed, its tolerance range, and g in USD.
| Rank | Pair (V3 fee tier) | Trade notional (USD) | budget_consumed | Tolerance range | g (USD) |
|---|---|---|---|---|---|
| 1 | ETH → USDC (0.05%) | $1 303 544 | 100.0% | Default-tolerance | −$5 757 |
| 2 | USDT → USDC (0.01%) | $1 099 642 | 99.7% | Default-tolerance | −$5 459 |
| 3 | ETH → USDT (0.30%) | $1 097 905 | 99.9% | Default-tolerance | −$5 235 |
| 4 | USDT → XAUT (0.05%) | $1 038 130 | 100.0% | Default-tolerance | −$5 127 |
| 5 | ETH → USDT (0.05%) | $1 062 208 | 99.8% | Default-tolerance | −$5 084 |
| 6 | USDT → USDC (0.01%) | $999 674 | 99.9% | Default-tolerance | −$4 972 |
| 7 | ETH → USDC (0.05%) | $947 575 | 99.8% | Default-tolerance | −$4 756 |
| 8 | ETH → USDC (0.05%) | $1 010 900 | 100.0% | Default-tolerance | −$4 483 |
| 9 | ETH → USDC (0.05%) | $1 044 981 | 100.0% | Default-tolerance | −$4 378 |
| 10 | ETH → USDC (0.05%) | $952 258 | 99.7% | Default-tolerance | −$4 256 |
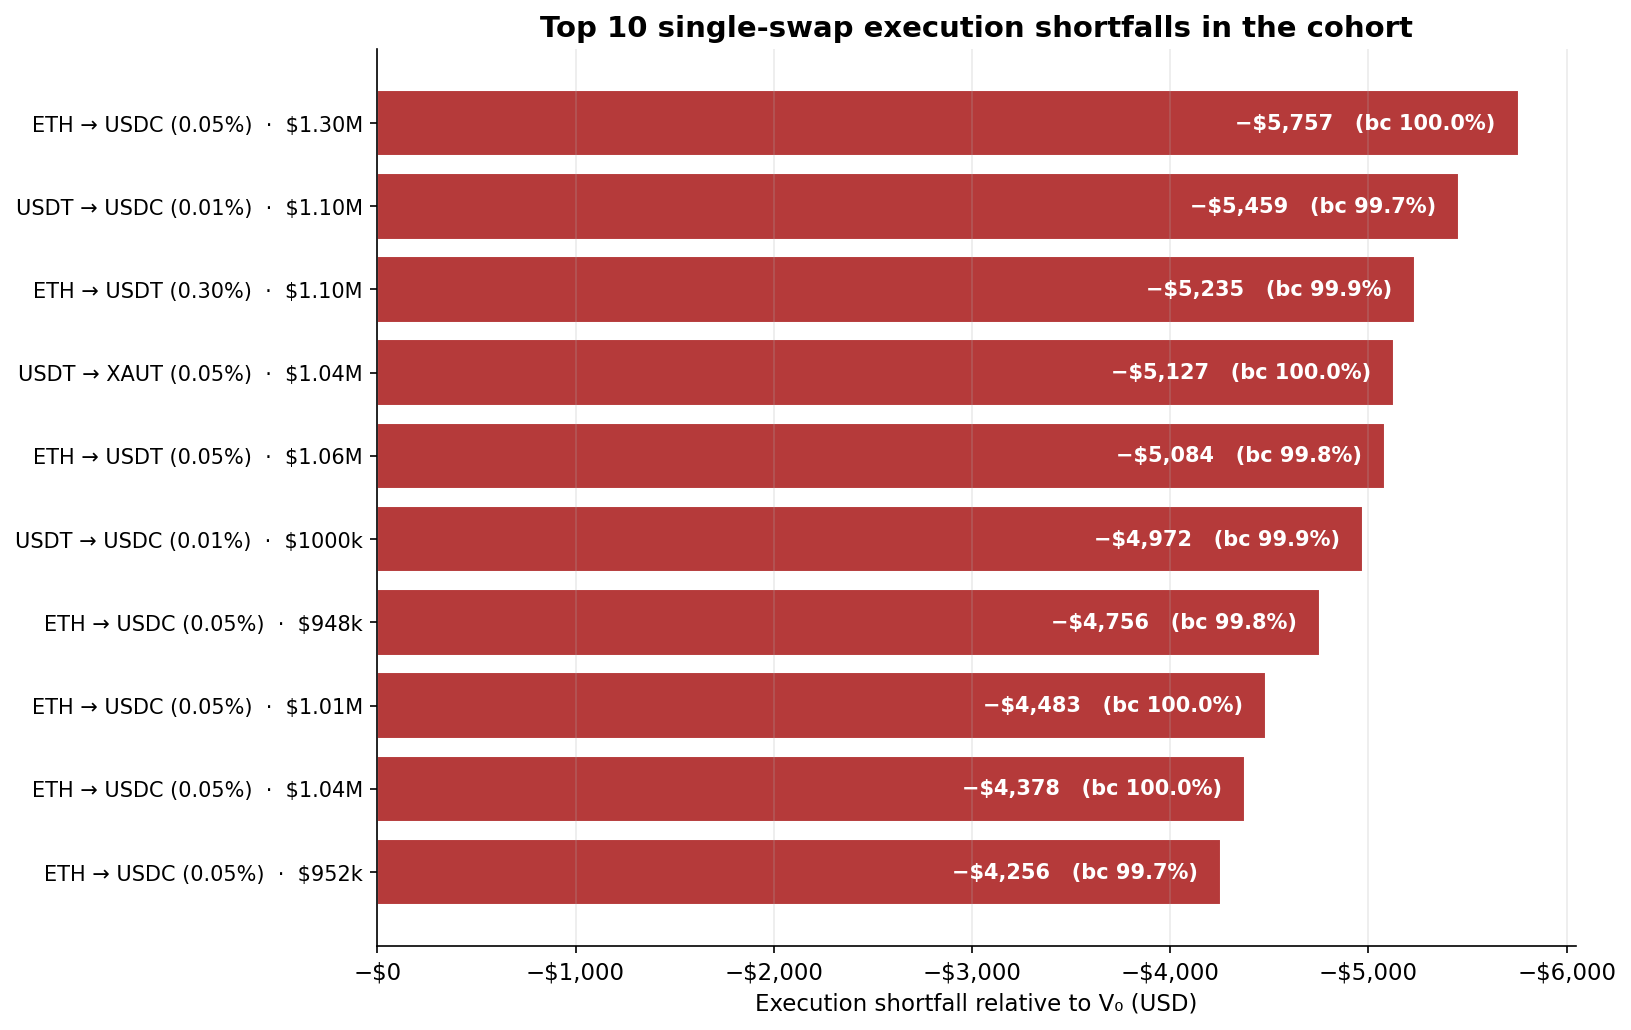
All ten largest execution shortfalls occur within the default-tolerance range and settle within 1% of the signed execution floor. This concentration is consistent with Section 2.2.2, where the share of swaps settling near the signed execution floor remains broadly stable across notional buckets.
Table 2.2.3c: Magnitude of favorable outcomes. Each row restricts to swaps where budget_consumed < 0 (V₁ better than V₀ at float precision). upside_bps = (V₁ − V₀) / V₀ × 10000 for exact-in, or (V₀ − V₁) / V₀ × 10000 for exact-out, positive throughout. Sum-USD is the sum of (positive-by-convention) g values across the range's favorable swaps.
| Tolerance range | n with bc < 0 | Median upside (bps) | p90 upside (bps) | Max upside (bps) | Sum of upside g, USD | Median upside g, USD |
|---|---|---|---|---|---|---|
| Default-tolerance (n = 286) | 22 (7.7% of range) | ~0 bps | 2 bps | 3 bps | +$99.62 | +$0.25 |
| Loose (n = 46) | 1 (2.2% of range; n < 5, wide interval) | 0 bps | 0 bps | 0 bps | +$2.35 | +$2.35 |
| Full analyzed cohort | 23 | ~0 bps | 2 bps | 3 bps | +$101.97 ≈ +$102 | +$0.25 |
Favorable outcomes are small even when they occur: the largest observed improvement measures only +3 bps relative to V₀.
2.3 Unusual activity periods inside the cohort
The cohort includes a small set of swaps touching pools that experienced unusual activity periods during the observation window. These swaps are not removed from the canonical cohort: they are part of what was observed in public-mempool Uniswap V3 activity. However, because these pools experienced temporary volume spikes that were materially different from their routine activity, we report their effect separately.
The purpose of this section is not to redefine the cohort, but to show how much of the measured distribution is associated with these unusual periods. Removing the 48 cohort swaps that touch them strengthens the headline metrics: default-tolerance floor concentration rises from 64.0% to 78.3%, and the adverse-outcome share rises from 79.8% to 87.0%. The primary cohort definition (Section 4.2) and the headline findings are not modified by anything in this section.
2.3.1 Unusual activity periods identified in the cohort
Table 2.3.1 reports the five token pairs touched by cohort swaps that exhibited extreme temporary volume bursts during the 90-day observation window. A pair is flagged under the criterion defined in Section 4.8.
Table 2.3.1: Volume profile of the five flagged pairs. Median, peak, and max/median ratio of daily USD volume across the 90-day window, with the peak-volume window. Full per-pair statistics and event-context notes are in Appendix B.
| Pair | Median daily volume | Peak daily volume | Max / median | Peak window |
|---|---|---|---|---|
| aWETH / WETH | $29 | $301M | ~1.0 × 10⁷ | 2026-04-19 → 2026-04-21 |
| lsETH / WETH | $3.8k | $4.2M | ~1.1 × 10³ | 2026-03-11 |
| FIDD / USDT | $36k | $5.9M | ~1.6 × 10² | 2026-04-14, 2026-04-16 |
| WBTC / solvBTC | $42k | $6.4M | ~1.5 × 10² | 2026-02-25, 2026-03-05, 2026-03-23 |
| FIDD / USDC | $36k | $4.0M | ~1.1 × 10² | 2026-04-14, 2026-04-16 |
The flagged-pair subset consists of pools with low routine activity and abrupt temporary volume spikes during the observation window. Five pairs satisfy the criterion defined in Section 4.8, accounting for 48 of the 332 cohort swaps. The largest cluster is associated with aWETH/WETH activity during a period that coincides with publicly discussed Kelp DAO-related activity and Aave V3 collateral dynamics. Appendix B provides the full pair inventory, peak dates, and volume profiles.
2.3.2 Headline metrics excluding unusual-activity swaps
The table below reports the same headline metrics after excluding the 48 swaps that touched unusual-activity pairs. This exclusion is not the main cohort definition; it isolates the effect of the unusual periods described above.
Table 2.3.2: Headline-metric comparison.
| Metric | Full cohort (n = 332) | Excluding swaps touching flagged pairs (n = 284) |
|---|---|---|
| Default-tolerance subcohort size | 286 | 226 |
| Loose subcohort size | 46 | 42 |
| Share within 1% of signed execution floor (default-tolerance) | 64.0% | 78.3% |
| Share within 5% of signed execution floor (default-tolerance) | 68.5% | 84.1% |
| Share within 1% of signed execution floor (full cohort) | 55.1% | 62.7% |
| Favorable outcomes (V₁ better than V₀, count) | 26 (7.8%) | 18 (6.3%) |
| V₁ = V₀ wei-exact (count) | 41 (12.3%) | 19 (6.7%) |
| Adverse outcomes (V₁ worse than V₀, count) | 265 (79.8%) | 247 (87.0%) |
| Aggregate gains (USD) | $102 | $50 |
| Aggregate cohort execution shortfall (USD) | $223 865 | $213 158 |
| Mean per-swap execution shortfall (full cohort) | $674 | $751 |
Three observed shifts follow from the comparison:
-
At-floor concentration: the default-tolerance share clearing within 1% of the signed execution floor rises from 64.0% to 78.3% when swaps touching flagged pairs are excluded.
-
Sign asymmetry: the share of negative-for-user outcomes rises from 79.8% to 87.0%.
-
Aggregate execution shortfall: aggregate USD shortfall moves by ~$10.7k (about 4.8% of the $223k headline) when the 48 swaps are removed; mean per-swap shortfall rises from $674 to $751.
2.3.3 Why unusual-activity swaps softened the headline effect
The unusual-activity swaps are over-represented among favorable and exact outcomes. They account for 8 of the cohort's 26 favorable outcomes (31%) and 22 of the 41 wei-exact outcomes (54%), despite representing only 14.5% of the cohort overall. This explains why removing them makes the distribution more adverse: these periods added many of the outcomes that made the cohort look less severe.
We refer to favorable and exact outcomes collectively as the non-negative side of the distribution.
The 67 non-negative outcomes (26 favorable + 41 wei-exact V₁ = V₀) are the part of the distribution that, in isolation, would look least adverse to a user. To assess whether they resemble the broader cohort or concentrate in structurally distinct execution environments, we tabulate the share of each feature within the full cohort and within the non-negative subset. A feature whose share is materially higher in the non-negative column than in the full-cohort column is over-represented on the non-negative side.
Table 2.3.3: Feature concentration on the non-negative side of the distribution. Counts are absolute; percentages are within the indicated denominator. Non-negative outcomes are favorable outcomes (V₁ better than V₀) plus wei-exact outcomes (V₁ = V₀).
| Feature | Share of full cohort (n = 332) | Share of non-negative outcomes (n = 67) | Share of favorable (n = 26) | Share of wei-exact (n = 41) |
|---|---|---|---|---|
| Touches a flagged pair (any leg, Section 4.8) | 14.5% (48) | 44.8% (30) | 30.8% (8) | 53.7% (22) |
| Touches an aWETH route (Section 4.7) | 11.4% (38) | 40.3% (27) | 26.9% (7) | 48.8% (20) |
| Long-tail pair on inclusion date (< $1M/day) | 6.0% (20) | 9.0% (6) | 3.8% (1) | 12.2% (5) |
| Mid-volume pair on inclusion date ($1M–$50M/day) | 22.3% (74) | 17.9% (12) | 3.8% (1) | 26.8% (11) |
| Majors pair on inclusion date (≥ $50M/day) | 70.8% (235) | 71.6% (48) | 88.5% (23) | 61.0% (25) |
| Fee tier 0.01% (stable-stable pools) | 36.7% (122) | 32.8% (22) | 46.2% (12) | 24.4% (10) |
| Fee tier 0.05% | 51.8% (172) | 53.7% (36) | 34.6% (9) | 65.9% (27) |
| Fee tier 0.30% | 11.4% (38) | 13.4% (9) | 19.2% (5) | 9.8% (4) |
| Single-hop route | 84.0% (279) | 89.6% (60) | 88.5% (23) | 90.2% (37) |
| Multi-hop route (≥ 2 legs) | 16.0% (53) | 10.4% (7) | 11.5% (3) | 9.8% (4) |
| Mempool dwell = 1 block | 87.7% (291) | 85.1% (57) | 88.5% (23) | 82.9% (34) |
| Mempool dwell = 0 blocks | 9.9% (33) | 9.0% (6) | 3.8% (1) | 12.2% (5) |
The 67 non-negative outcomes split into two subpopulations whose feature concentrations differ qualitatively.
Exact outcomes (V₁ = V₀; n = 41). Touching a flagged pair is ~3.7× more common among wei-exact outcomes (53.7%) than among cohort swaps in general (14.5%); the aWETH-route share rises from 11.4% to 48.8% along the same axis. The 0.05% fee tier carries 65.9% of the wei-exacts (vs 51.8% baseline) and 12.2% land on long-tail pairs (vs 6.0% baseline).
Favorable outcomes (V₁ > V₀; n = 26). 88.5% of favorable outcomes occur on majors-tier pairs (≥ $50 million/day) against a 70.8% cohort baseline, and 46.2% on the 0.01% fee tier (the canonical stable-stable tier) against a 36.7% baseline.
Routes that do not over-contribute. Multi-hop swaps, multi-block-dwell swaps, and zero-dwell swaps are not over-represented in the non-negative subset (their non-negative shares are at or below their cohort baseline shares). These features are not over-represented in the non-negative subset and therefore do not appear to be the main distinguishing characteristics of that side of the distribution.
Interpretation of these compositional differences is developed in Section 3.4.
3. Interpretation and conclusion
Section 2 measured the shape. This section explains what that shape suggests, without attributing the measured gaps to MEV, market movement, or liquidity updates individually. Each subsection takes one feature of the observed distribution and states what the data can and cannot conclude about it. Attribution between extraction strategies, informed counterflow, liquidity updates, and market drift is future work (Section 6).
While the study does not attribute individual swaps to MEV, the shape of the distribution is not what one would expect from neutral market movement alone. The repeated concentration just inside the signed execution floor suggests active boundary-seeking behavior, whether through strategic extraction, adverse selection, routing dynamics, or other forms of order-flow interaction.
3.1 The signed execution floor as a boundary
The signed execution floor is not only a validity condition. In the default-tolerance subcohort, it is also where realized execution frequently concentrates. This is the key empirical shape requiring interpretation: a large share of successful swaps settle very close to the worst execution price the user authorized, while relatively little mass appears in the interior of the authorized range.
This pattern is consistent with execution pressure operating against the user until either the signed floor is approached or the available movement is exhausted. Under sandwich-style extraction, for example, the user's tolerance defines the maximum adverse movement that can be imposed without causing the transaction to revert. Other mechanisms — informed counterflow, liquidity updates between simulation and inclusion, ordering effects — can produce similar user-side effects without requiring the paper to attribute individual swaps to a specific strategy.
The important point is distributional rather than causal. The observed distribution is not merely "execution below simulation": it is boundary-concentrated execution. In the default-tolerance range, realized settlement frequently lands at the edge of what the user authorized — a pattern difficult to explain as diffuse, symmetric execution noise alone.
3.2 Right-censoring of the observed distribution
The measured V₀/V₁ distribution is a post-survival distribution: it contains only swaps that executed successfully. Transactions that would have settled beyond the signed execution floor revert and therefore do not appear in the realized-outcome cohort.
This censoring boundary matters because the signed execution floor is both a user protection mechanism and a data boundary. Outcomes can approach the floor, but successful swaps cannot cross it. Tightening the signed tolerance moves that boundary closer to V₀ and increases the probability that adverse movement becomes an unobserved revert rather than an observed execution outcome.
Section 2.1.3 shows that, in this study, the floor is approached more visibly than it is crossed. The companion revert-rate measurement suggests that slippage-induced reverts are a small fraction of attempts, while the successful-swap cohort shows strong concentration just inside the floor. This supports the interpretation that the signed execution floor is not merely a distant guardrail. In the default-tolerance range, it is a boundary around which realized execution frequently concentrates.
The reverted population itself is not reconstructed into V₀/V₁ outcomes in this paper, so this remains contextual evidence rather than a full failed-outcome distribution. A complete treatment of reverted swaps is left to future work.
3.3 Loose-tolerance swaps may represent a different execution population
The loose-tolerance subcohort does not behave like the default-tolerance subcohort with the same distribution stretched over a wider authorized range. Outcomes in this group remain mostly adverse relative to V₀ (93.5% settle below V₀), but they do not concentrate near the signed execution floor.
A diagnostic stratification across pair volume, route complexity, asset tier, flagged-pair exposure, notional size, and fee tier did not isolate a single structural driver of the loose-tolerance distribution. In particular, the loose-tolerance subcohort does not appear less liquid by median pair volume, nor more route-complex than the default-tolerance subcohort, nor more exposed to flagged unusual-activity pairs. In this cohort, loose-tolerance swaps are instead more concentrated in 0.01% fee-tier stable-stable pools, which weakens the simple explanation that wider tolerances mainly reflect illiquid or exotic assets. (Full diagnostic in tolerance_diagnostic.md, referenced in Section 7.)
The safer interpretation is that loose-tolerance swaps represent a different observed execution population whose drivers are not fully captured by the present dataset. Factors such as interface source, wallet or bot behavior, user-configured tolerance settings, or intra-block execution dynamics may all contribute, but none is directly measured here. This paper therefore treats loose-tolerance swaps as a distinct observed population, but does not attribute their outcome structure to a specific asset, route, or liquidity characteristic.
The loose-tolerance subcohort shows that adverse execution can remain common even when outcomes do not concentrate near the signed execution floor. The drivers of that difference are not identified by the present features and remain future work (Section 6).
3.4 Concentrated-liquidity amplification
Because liquidity is not uniformly distributed across the curve, the same reserve-changing activity can produce very different execution movement depending on where the swap lands in the tick structure. Uniswap V3 concentrates liquidity into ticks, so execution pressure near thin tick ranges may translate into larger settlement movement than it would in a uniform-liquidity venue.
This does not attribute any individual swap to tick-level liquidity changes, JIT liquidity, or sandwich extraction. The study does not decompose execution movement by tick depth. This makes concentrated liquidity a plausible amplifier of the observed distribution, but not a measured attribution channel in this study.
3.5 Interpreting exact and favorable outcomes
The non-adverse side of the distribution contains two different populations: exact outcomes and favorable outcomes. They should not be interpreted as the mirror image of the adverse side.
Exact outcomes occur when V₁ = V₀. In this framework, that means the pool state relevant to the swap did not meaningfully change between the V₀ simulation position and the transaction's realized execution position. This interpretation is consistent with the over-representation of Aave-receipt routes in the exact-outcome bin: 20 of the 32 such swaps settle wei-exact, and many of these routes belong to unusual-activity periods with low routine activity outside temporary bursts.
Favorable outcomes are different. They correspond to small positive movements relative to V₀, not to unchanged execution. These outcomes are concentrated on majors-tier pairs and low-fee pools, where intra-block trading can move reserves slightly in either direction. In some cases, unrelated trades before the user's transaction may improve the pool price for the user. The observed magnitudes are very small: the median favorable movement is approximately 0 bps and the maximum is +3 bps.
This scale is not comparable to the adverse side of the distribution. In the default-tolerance range, many adverse executions concentrate near the user's signed execution floor, commonly around a 50 bps tolerance. Compared with a maximum favorable movement of +3 bps, a 50 bps adverse movement is roughly 16.7 times larger on a basis-point scale.
The economic asymmetry is even larger in aggregate. Across the cohort, favorable outcomes sum to approximately $102, while adverse execution shortfall sums to $223 865. Favorable outcomes therefore exist, but they do not offset the adverse side either in execution-price movement or in dollar magnitude.
3.6 Interpreting the unusual-activity subset
The unusual-activity subset softened the headline effect because it contributed disproportionately to exact and favorable outcomes. When these swaps are excluded, floor concentration and adverse-outcome share both increase. The subset therefore appears less like the source of the at-floor finding and more like a structurally distinct slice that diluted it.
The largest flagged cluster occurs around aWETH/WETH activity during a period that coincides with publicly discussed Kelp DAO-related activity and Aave V3 collateral dynamics. These pools had very low routine activity relative to the temporary burst observed during the window. This matters because execution environments are not only defined by liquidity depth, but also by who is monitoring the pool, how actively arbitrage paths are maintained, and whether searcher or market-maker infrastructure is continuously adapted to that route.
One possible interpretation is that abrupt activity in normally quiet receipt-token or collateral-linked pools may produce execution environments that differ from continuously traded major pairs. In such pools, temporary price movements may be less immediately competed away through public-mempool arbitrage, or may be handled through private order flow not visible in this study. This could help explain why flagged-pair swaps are over-represented among exact and favorable outcomes.
The data does not establish that arbitrageurs, market makers, or MEV searchers failed to adapt. It only shows that these swaps occurred in pools whose activity profile was unusual relative to their own 90-day baseline. The conservative conclusion is therefore that the unusual-activity subset is structurally distinct from the rest of the cohort, and that excluding it strengthens rather than weakens the main execution-gap finding.
3.7 Conclusion
The measured execution gap is not a diffuse cloud of small random deviations around simulation. In the default-tolerance range, outcomes concentrate near the signed execution floor, favorable outcomes are rare and economically small, and the unusual-activity subset dilutes rather than creates the effect.
The study does not attribute the gap to MEV, market drift, liquidity updates, or routing behavior individually. Its contribution is to measure the aggregate user-side outcome and show that the distribution has structure. Attribution is the next research problem.
Within the analyzed public-mempool Uniswap V3 cohort, slippage tolerance often behaves less like a remote safety buffer than like the realized execution price.
4. Methodology
This study measures the execution gap between the market outcome previewed at simulation time and the realized outcome users receive after execution. This section walks through how swaps are collected, reconstructed, and measured. Formal variable, tolerance, and budget_consumed definitions live in Appendix A; this section stays narrative.
4.1 Public-mempool observation
The execution-gap construction requires knowing when each transaction first became visible in public orderflow. To establish this, we use the Flashbots Mempool Dumpster, an open-source aggregation of transactions observed across multiple independent public-mempool observation points (Flashbots, bloXroute, Chainbound, and other providers).
Presence in the dumpster establishes that a transaction was publicly observable before inclusion, and it provides an observed mempool-arrival time rather than an estimated one. Every transaction in the analyzed cohort appears in this dataset; this is the study's public-mempool inclusion criterion.
4.2 Cohort construction
The study focuses on Ethereum mainnet swaps executed through Uniswap V3, a major venue for economically meaningful onchain swaps.
We restrict the cohort to swaps that:
- are above $50 000 USD notional, to focus on trades where execution quality is economically material;
- are directly submitted by externally-owned accounts (EOAs), with smart-account wallets (Safe multisigs, ERC-4337 accounts, EOAs delegated via EIP-7702) out of scope, because their authorization and execution models differ from direct router submissions;
- are routed through official Uniswap V3 router contracts, executing against Uniswap V3 pools;
- are observed in the public mempool before inclusion, per Section 4.1.
The router set is four contract addresses: the original V3 SwapRouter (0xE592…1564), SwapRouter02 (0x68b3…fc45), and the UniversalRouter v1 and v1.2 deployments (0x3fC9…7FAD, 0x66a9…a8af). The exact list is the constant UNISWAP_V3_ROUTER_ADDRESSES in the open-source pipeline (Section 7).
Aggregator-routed swaps (1inch, 0x, Paraswap, CoW Swap) are excluded because they may fill orders against private market makers or internal liquidity rather than the public onchain-pool execution surface this study isolates.
Both single-hop swaps and multi-hop paths are included. Multi-hop routes are not decomposed into independent swaps or reclassified according to intermediary assets. In practice, routing systems frequently traverse intermediate assets or pools to reach deeper liquidity; treating individual hops independently would distort the economic execution surface experienced by the user. The unit of analysis throughout the study is therefore the user transaction itself rather than its internal routing path.
A per-wallet cap of 5 swaps is applied so that a small number of high-frequency addresses cannot dominate the population. This makes the cohort closer to a user-level sample, at the cost of not being a transaction-volume-weighted census.
Table 4.2a: Public-mempool Uniswap V3 router population context. Counts are scoped to the 2026-02-13 → 2026-05-13 observation window and to transactions visible through the public mempool (Section 4.1).
| Stage | Count | Share of prior |
|---|---|---|
| Public-mempool V3 router attempts | 428 157 | 100.00% |
| Successful attempts | 359 544 | 83.97% |
| Successful swaps ≥ $50 000 notional | 1 249 | 0.35% |
Table 4.2b: Cohort construction funnel. Counts show how the final analyzed cohort is derived from the 1 249 successful public-mempool Uniswap V3 swaps above $50 000 notional. Each row reports the surviving population after the indicated filter is applied to the population above it.
| Stage | Count | Share of prior | Filter |
|---|---|---|---|
| Successful public-mempool V3 swaps ≥ $50 000 | 1 249 | 100.00% | Initial eligible population |
| Successfully decoded | 973 | 77.90% | Supported V3 calldata decode |
| Per-wallet cap applied | 432 | 44.40% | Maximum 5 swaps per sender address |
| V₀/V₁ reconstructed | 356 | 82.41% | Simulation and receipt reconstruction succeed |
| Priced | 354 | 99.44% | Price coverage available |
| Clean | 337 | 95.20% | Defined gap and observed dwell |
| Decoder exclusion | 332 | 98.52% | 5 split-route exact-out swaps dropped |
| Full analyzed cohort | 332 | 100.00% | Final cohort |
The first table defines the public-mempool population from which the study samples. The second table describes the reconstruction pipeline applied to the economically large successful-swap subset. The initial Dune cap of 1 500 was not binding because the query returned 1 249 eligible swaps. The binding sampling choice is the per-wallet cap, which reduces the decoded set from 973 to 432 swaps. The final cohort should therefore be interpreted as a capped observational sample of large public-mempool Uniswap V3 swaps, not as a census of all qualifying swaps.
The final decoder exclusion concerns five split-route exact-out swaps whose signed maximum input cannot yet be reconstructed under the current command-stream parser; this limitation is discussed in Section 5.
Median mempool dwell time in the cohort is 1 block; 98% of swaps are included within 1 or 2 blocks. The cohort therefore primarily reflects short-dwell public-mempool execution, not long-pending transactions.
4.3 Reconstructing the simulated market outcome (V₀)
For each transaction we reconstruct an approximation of the market outcome visible to users at signing/submission time. We denote this quantity V₀ (formal definition in Appendix A); it is reconstructed by reproducing the top-of-block simulation process used by wallets and applications prior to transaction submission.
V₀ is computed by replaying the user's exact transaction calldata in a top-of-block simulation (transaction_index = 0, using Tenderly), against the chain state corresponding to the transaction's first observed public-mempool appearance. The pipeline uses the Flashbots Mempool Dumpster first-observed timestamp, together with the transaction's inclusion block and observed dwell time, to select the closest available pre-inclusion block state. The cohort median dwell is one block and 98% of swaps exhibit one- or two-block dwell, so the simulated state is usually close to the chain state immediately preceding inclusion. This rule is not intended to reconstruct the user's exact signing timestamp; it reproduces the kind of top-of-block execution preview that a wallet, interface, or trading system could have computed before the transaction's final ordering and inclusion were known.
This construction approximates the market outcome visible at signing time. It is optimistic relative to the realized ordering position: setting transaction_index = 0 removes both adverse and benign same-block activity that later occurs ahead of the transaction (Section 5). We prefer the top-of-block construction because it approximates the information surface visible at signing time and avoids conditioning V₀ on future same-block activity unavailable to users.
The user's signed execution boundary is read directly from calldata: amountOutMinimum for exact-in swaps and amountInMaximum for exact-out swaps. In the main text, we refer to this boundary as the signed execution floor for readability; Appendix A defines the exact-in and exact-out forms symmetrically. Two cases are worth flagging:
- Router-specific: for UniversalRouter swaps (the majority of the cohort), the binding slippage check sits on the final transfer-out command, not on the swap leg itself, and our decoder reads it from there. Reading the swap leg instead would mis-report most UniversalRouter swaps as having no slippage protection.
- Direction-specific: of the 16 exact-out swaps in the pre-cohort population, 11 decode cleanly under the symmetric metric (Section 4.5) and are included; the remaining 5 are split-route exact-out executions the decoder mishandles and are excluded (Section 5).
4.4 Reconstructing realized execution (V₁)
We denote the realized outcome as V₁ (formal definition in Appendix A): the amount of output tokens the user actually received (exact-in) or the amount of input tokens they actually paid (exact-out).
Unlike V₀, V₁ is not simulated. It is reconstructed directly from the transaction receipt and the emitted logs recorded onchain. Reading the receipt, rather than re-simulating the included transaction, preserves in-block execution and ordering effects in V₁, including same-block dynamics that post-hoc re-simulation may obscure.
This distinction matters particularly for multi-hop swaps and complex router flows. Rather than inferring outputs from intermediate swap operations, the analysis reconstructs the actual amount delivered to (or paid by) the user at settlement.
4.5 Measuring execution degradation
The execution gap is the difference between the simulated market outcome V₀ and the realized settlement outcome V₁.
It is important to distinguish this measurement from the ordinary price impact of the user's own swap. V₀ is obtained by replaying the user's exact transaction calldata against the pre-inclusion chain state. As a result, V₀ already reflects the route, pool liquidity, fee tier, and price impact that the user's own transaction would have produced if executed at that simulated position.
The execution gap therefore does not measure the difference between a mid-market price and the swap's quoted output. It measures the additional deterioration between the simulated execution outcome available before inclusion and the realized settlement outcome after the transaction is ordered and included onchain. Some of that additional deterioration can still come from pool price movement, liquidity changes, or other transactions affecting the pool before inclusion; the key distinction is that the user's own initial price impact is already included in V₀.
The slippage budget consumed normalizes that gap against the user's authorized execution range (V₀ to the signed execution boundary), making swaps with very different signed tolerances (from 0.2 bps to 9 900 bps in this cohort) directly comparable on a single axis:
budget_consumed = 100%: realized settlement at the signed execution boundary, meaning one additional unit of adverse movement would have reverted the swap.budget_consumed = 0%: V₁ = V₀.budget_consumed < 0: V₁ is strictly better than V₀ from the user's perspective.
The metric is defined symmetrically for exact-in and exact-out swaps. Full formulas appear in Appendix A.
4.6 Tolerance-range partition
The full analyzed cohort (n = 332) splits into two ranges by the slippage tolerance the user signed.
Table 4.6: Tolerance-range partition. The default-tolerance range covers the 0.1%, 0.5%, and 1% presets that consumer-facing apps and wallets offer.
| Range | Tolerance range | n | Share |
|---|---|---|---|
| Default-tolerance range | 0 < tolerance ≤ 200 bps | 286 | 86.1% |
| Loose-tolerance range | tolerance > 200 bps | 46 | 13.9% |
The median signed tolerance is 50 bps (the 0.5% preset), both across the full cohort and within the default-tolerance subcohort. The minimum observed tolerance is 0.2 bps; no swap in the cohort signed a literal zero tolerance. (An earlier version of this report broke out a third "Tight (tolerance = 0)" range; it turned out to be a decoder artifact and has been retired.)
The headline result in Section 2.1 is reported on the default-tolerance subcohort because that range corresponds to common consumer-facing defaults and contains the primary floor-concentration finding. The full partition is reported above so the reader can confirm nothing is dropped after the fact.
4.7 Cohort inclusion adjustments
Two categories of swap that earlier versions of this analysis filtered out are now retained in the cohort. Both decisions are documented here for reproducibility; their distributional behavior is characterized empirically in Section 5.
Aave-receipt routes. Earlier versions of the analysis excluded these routes; this version retains them in the cohort. aWETH is an Aave lending-receipt token with pricing dynamics distinct from a simple wrapped-asset conversion. 32 cohort swaps route aWETH against ETH or WETH on Uniswap V3 pools. The earlier exclusion operated by token-pair identity rather than by execution characteristics, which introduced selection effects independent of the execution-gap dimensions this study measures. Their distributional behavior is reported in Section 2.3.
Exact-out swaps. The metric is defined symmetrically (Section 4.5); 11 of the 16 exact-out swaps in the source population decode cleanly under that symmetric form and are included in the cohort. The remaining 5 are split-route exact-out executions where the decoder reads only one leg's amountInMaximum and are excluded; see the exact-out decoder limitation in Section 5.
4.8 Definition of flagged pairs and unusual activity periods
The robustness analysis in Section 2.3 uses an empirical flagging rule based on per-pair daily trading volume during the 90-day study window.
For every token pair touched by any cohort swap, across any route leg, we reconstruct daily USD volume using Dune dex.trades. The cohort touches 32 unique pairs across 387 swap legs: 279 single-hop swaps and 53 multi-hop swaps.
A pair is flagged if its 90-day daily-volume distribution satisfies both:
- max / median ≥ 100
- median < $100 000 per day
The first condition identifies pairs whose busiest day is at least two orders of magnitude larger than a typical day. The second condition limits the flag to pairs with low routine activity, excluding high-volume pairs that simply experience large but ordinary volume variation. The criterion is empirical: a pair qualifies based on its volume shape, not on whether a public incident has been identified.
Under this rule, five of the 32 cohort-touched pairs are flagged. A cohort swap is categorized as touching a flagged pair if any leg of its route, single-hop or multi-hop, traverses one of those five pairs. Under this definition, 48 of the 332 cohort swaps (14.5%) touch a flagged pair.
The full 32-pair inventory, flagged-pair peak dates, inclusion-date distribution, and descriptive event notes are reported in Appendix B.
5. Limitations
The findings reported in this article apply within a defined scope. Three boundaries — public-mempool inclusion, direct-router execution, and the ≥$50 000 notional cutoff — are cohort scope definitions (Section 4.1, Section 4.2) rather than weaknesses of the measurement. The limitations below identify what the methodology cannot establish about the cohort, and which populations adjacent to it are not separately characterized.
Measurement limitations
- Optimistic V₀ counterfactual. Setting
transaction_index = 0in the arrival block removes both adverse and benign same-block activity occurring ahead of the transaction.budget_consumedis therefore an upper bound on realized adverse drift relative to a fairness-of-execution counterfactual (stated also in Appendix A and Section 4.3). The qualitative findings, including floor concentration in the default-tolerance range, limited interior mass, and differences across tolerance ranges, are not driven by this choice; the absolute magnitude ofbudget_consumedcould be smaller under a different counterfactual. - Execution-mechanism attribution unresolved. The measured execution gap aggregates extraction strategies, informed counterflow, liquidity updates, and ordinary market drift. The methodology reconstructs outcomes but does not distinguish strategic extraction from naturally occurring market behavior. The Section 3 interpretation offers one model consistent with the observed shape; this study does not establish causality.
- Exact-out split-route decoding (5 swaps). Five UniversalRouter split-route exact-out swaps could not be reconstructed because the current decoder interprets per-leg input limits rather than the aggregate signed maximum across all routes.
budget_consumedis therefore undefined for these executions and they are excluded.
Coverage and generalizability
- Failed swaps not modeled. The analysis focuses on successful onchain executions. Transactions that revert at the slippage check are economically meaningful outcomes but are not reconstructed within the gap measurement itself. As a result, the measured distribution describes the outcomes of surviving swaps, not the full distribution of attempted swaps. The companion revert-rate measurement reported in Section 2.1.3 is contextual evidence and is not integrated into the V₀/V₁ reconstruction. A full reconstruction of failed swaps into the gap framework remains future work (Section 6); the companion artifacts and the CLIs that produce them are documented in Section 7.
- Decode-skipped population. 276 of 1 249 candidate swaps (22%) could not be reconstructed because of unsupported UniversalRouter execution structures and were excluded before simulation. The execution characteristics of this excluded population are not separately measured and may differ from the included sample.
- Account-model coverage. The cohort does not explicitly characterize smart-account execution paths (Safe multisigs, ERC-4337 accounts, EIP-7702-delegated EOAs, and similar). These systems may interact with routing and execution differently from traditional EOAs, and their behavior under this study's measurement framework is not separately quantified.
- Route-level asset classification not assigned per transaction. Uniswap V3 frequently executes through multi-hop routes traversing pools with different liquidity characteristics, so transaction-level classification by asset category (major, mid-volume, long-tail) is non-unique. The Section 2.2 feature analysis therefore uses route-touch criteria ("touches a major pair", "touches a flagged pair") rather than assigning each transaction uniquely to a single category. As a result, pool-specific effects may be diluted in aggregate transaction-level measurements.
- Sampling truncation. The cohort is a capped sample of the eligible 90-day population, not the full population. Processing was limited to a fixed number of candidate transactions, and a per-wallet cap of 5 swaps was applied. Eligible swaps beyond these caps were not analyzed. The cohort should be interpreted as a large observational sample rather than a census of all qualifying ≥$50 000 public-mempool V3 swaps in the window.
- Tolerance-selection drivers not classified. The paper partitions outcomes by signed tolerance, but does not model why a swap was signed with that tolerance. Loose-tolerance swaps may differ systematically from default-tolerance swaps in asset liquidity, route composition, volatility, interface source, or user type. A stratified analysis of tolerance-selection drivers is left to future work.
- Finite observation window. Results are conditional on the 2026-02-13 → 2026-05-13 observation period and on the order-flow composition observed during that window. Different market environments may produce different execution-gap distributions.
6. Future work
The most important follow-up to this study is execution-gap attribution: decomposing the measured execution gap into strategic extraction, informed counterflow, liquidity updates, and ordinary market drift. The present methodology reconstructs outcomes but does not distinguish these mechanisms, as discussed in Section 5. From a user's perspective these mechanisms are economically interchangeable because they consume authorized slippage identically. For protocol design and execution-system research, separating them is the next measurement problem.
Observable onchain structure may provide partial attribution signals, including same-pool transaction activity surrounding the user's transaction, ordering patterns within and across blocks, bundle relationships, and liquidity updates. Because these signals are not uniquely identifying, attribution under such a framework would remain approximate rather than definitive.
Beyond attribution, several extensions of the present measurement framework are natural:
- Reverted-swap dynamics. The companion revert-rate measurement reported in Section 2.1.3 provides contextual evidence (slippage-induced reverts at approximately 4.2% of public-mempool direct Uniswap V3 attempts), but not a full failed-outcome distribution. A dedicated reverted-swap analysis would reconstruct the counterfactual failed-settlement path under the same notional, routing, and cohort filters as the successful-swap study, producing a distribution of attempted outcomes rather than only surviving outcomes. This addresses the right-censoring caveat discussed in Section 5.
- Full UniversalRouter command-stream parsing. Reconstruct the 276 decode-skipped swaps and the 5 exact-out split-route swaps to close the two known decoder gaps and permit a census-style cohort within the present scope.
- Other execution venues. Adapt the methodology to private routing channels, RFQ systems, batch auctions, and intent-based execution environments. Each venue has a different mempool-visibility model and a different signing-time counterfactual, so the framework requires reformulation rather than direct transplant.
- Granular route decomposition. Decompose multi-hop routes into per-leg contributions to test whether pool-specific liquidity characteristics, rather than transaction-level features, drive the observed concentration structures.
- Stratified analysis of smart-account execution. Characterize execution behavior for Safe multisigs, ERC-4337 accounts, and EIP-7702-delegated EOAs, which may interact with routing and slippage logic differently from traditional EOAs.
Together, these extensions would separate what the present study intentionally aggregates: mechanism attribution, failed execution, broader routing surfaces, and account-model variation.
7. Reproducibility
Every table and chart in this article is produced from the open-source pipeline at github.com/IntentGuardLabs/eth-execution-gap. The repository contains the source code, input artifacts, intermediate per-swap data, and scripts used to render the tables and figures.
Running the pipeline
git clone https://github.com/IntentGuardLabs/eth-execution-gap
cd eth-execution-gap

# Required env: DUNE_API_KEY, TENDERLY_API_KEY,
#               TENDERLY_ACCOUNT, TENDERLY_PROJECT, ETHERSCAN_API_KEY

# Full V3 cohort reconstruction (90-day window):
tsx cli/protocol-run.ts --protocol uniswap-v3 \
    --window-days 90 --min-amount 50000 \
    --max-per-wallet 5 --limit 1500

# Stratification and per-swap CSV underlying every table and figure;
# the tolerance-range partition (Section 4.6) and the 5-swap exact-out
# exclusion (Section 5) are applied at read time:
tsx cli/v3-stratify-report.ts

# Section 3.1 censoring numbers (companion measurement). Population-exact
# revert-rate via Dune SQL aggregation; revert-reason classification on a
# 4 000-tx random sample with per-tx Tenderly trace fetch:
tsx cli/v3-revert-rate.ts --window-days 30 --min-amount 50000 --sample-size 4000
Artifacts
The article is rendered from the following committed artifacts:
| Artifact | Path | Used in |
|---|---|---|
| Per-swap JSON (raw pipeline output) | reports/protocol-runs/2026-05-14T15-29-13-930Z_uniswap-v3.json | §2 |
| Per-swap CSV (analysis input) | reports/protocol-runs/2026-05-14T15-29-13-930Z_uniswap-v3.swaps.csv | §2 |
| Stratified breakdown (intermediate report) | reports/protocol-runs/2026-05-14T15-29-13-930Z_uniswap-v3.stratified.md | §2 |
| Revert-rate report | reports/v3-revert-rate/2026-05-13T21-44-36-689Z_v3-revert-rate.md | §3.1 |
| Tolerance vs. reverts | reports/v3-tolerance-vs-reverts/2026-05-13T23-34-01-501Z_v3-tolerance-vs-reverts.md | §3.1 |
| Pair-volume time series | reports/articles/03-the-execution-gap-on-uniswap-v3/pair-volume-90d.json | §4.8, Appendix B |
| Loose-vs-default tolerance diagnostic | reports/articles/03-the-execution-gap-on-uniswap-v3/tolerance_diagnostic.md (regenerated by tolerance_diagnostic.py) | §3.3 |
The CSV is the source of every table and figure in §2. Each chart-rendering script in reports/articles/03-the-execution-gap-on-uniswap-v3/ consumes the CSV directly.
Deterministic re-execution
Tenderly simulations and Etherscan receipts are content-addressed on disk under .cache/. Cached artifacts allow deterministic re-execution across repeated runs against the same input set without reissuing external API calls. The calldata decoder, receipt parser, slippage classifier, and per-tx Tenderly fetcher are unit-tested against synthetic ABI payloads and against onchain examples committed to the repository.
External data dependencies
Initial reconstruction requires the following external data sources, which are queried only on first run and cached thereafter:
- Flashbots Mempool Dumpster (public archive) — public-mempool inclusion timestamps.
- Tenderly (account-keyed API) — historical state simulation for V₀ and V₁ reconstruction.
- Etherscan (API key, free tier sufficient) — onchain receipts and basic block metadata.
- Dune Analytics (API key) —
dex.tradesper-day per-pair volume series (Section 4.8) and revert-rate aggregates (Section 3.1).
If any of these sources changes its schema, retention policy, or pricing, full re-execution from a clean cache may require adapter updates. The committed cache and the per-swap CSV remain stable independently of upstream availability, so downstream analysis and chart regeneration do not depend on continued external data access.
The pipeline is maintained publicly to support replication and methodological review.
Appendix A: Notation and formulas
This appendix collects the formal definitions of the variables and metrics used throughout the article. Section 4.3, Section 4.4, and Section 4.5 describe how V₀, V₁, and budget_consumed are reconstructed at the conceptual level.
A.1 Variables and signed boundary
For each swap, we measure two user-relevant token amounts:
- V₀ — token amount produced by the simulation preview defined in Section 4.3.
- Exact-in: output amount the swap would have produced under top-of-block simulation against the chain head at the transaction's first observed public-mempool appearance.
- Exact-out: input amount required under the same simulation to produce the user's signed output.
- V₁ — realized token amount onchain, read directly from the transaction receipt.
- Exact-in: output amount received.
- Exact-out: input amount paid.
V₀ and V₁ are in the native units of the user-relevant token. USD conversion is introduced in §A.4.
The user signs a binding execution boundary in calldata:
- Exact-in:
amountOutMinimum— minimum acceptable output; the swap reverts if the realized output would fall below it. - Exact-out:
amountInMaximum— maximum acceptable input; the swap reverts if the realized input would exceed it.
The article refers to this boundary in prose as the signed execution floor, treating it symmetrically as the worst-case settlement the user has authorized. Strictly, the boundary is a lower bound on output for exact-in and an upper bound on input for exact-out; the formal notation summary uses signed execution boundary.
A.2 Signed slippage tolerance
The user's signed tolerance is the proportional distance between V₀ and the signed boundary, defined symmetrically:
- Exact-in:
tolerance = (V₀ − amountOutMinimum) / V₀ - Exact-out:
tolerance = (amountInMaximum − V₀) / V₀
Tolerance is dimensionless and reported in basis points throughout the article.
A.3 Slippage budget consumed
The central metric of the article is the slippage budget consumed (budget_consumed), the fraction of the user's signed tolerance the realized settlement consumed:
- Exact-in:
budget_consumed = (V₀ − V₁) / (V₀ − amountOutMinimum) - Exact-out:
budget_consumed = (V₁ − V₀) / (amountInMaximum − V₀)
Both forms share the same interpretation:
budget_consumed = 1— realized settlement landed exactly at the signed boundary; one more increment of adverse drift would have reverted the swap.budget_consumed = 0— V₁ = V₀.budget_consumed < 0— the user did better than V₀ predicted (received more output, or paid less input).budget_consumed > 1— would correspond to settlement beyond the signed boundary; such swaps revert and therefore do not appear among successful executions.
The interpretation of exact and favorable outcomes is discussed in Section 3.4.
The article reports budget_consumed as a fraction in tables and as a percentage in prose.
A.4 USD-denominated execution gap
The per-swap signed execution gap g is the USD-denominated, sign-preserving translation of the user-side token difference between V₀ and V₁:
- Exact-in:
g = (V₁ − V₀) × price - Exact-out:
g = (V₀ − V₁) × price
where price is the per-token DeFiLlama USD price for the user-relevant token (Section 4.5). The same price is applied to V₀ and V₁ so that per-asset price drift between the two positions does not contaminate g.
The sign convention is symmetric across directions:
g < 0— user-side execution shortfall.g > 0— user-side gain.
This matches the per-swap CSV total_gap_usd column.
Execution shortfall is the user-side dollar magnitude when execution is adverse: execution_shortfall = max(0, −g). The article reports g as signed in tables and execution shortfall as positive magnitudes in prose.
A.5 Notation summary
| Symbol or name | Definition | Units |
|---|---|---|
| V₀ | Simulated token amount: output produced (exact-in) or input required (exact-out) under top-of-block preview at the transaction's first observed mempool appearance. Section 4.3. | User-relevant token, native units |
| V₁ | Realized onchain token amount: output received (exact-in) or input paid (exact-out), from the transaction receipt. Section 4.4. | User-relevant token, native units |
| signed execution boundary | The user's contractual boundary: amountOutMinimum (exact-in, lower bound on output) or amountInMaximum (exact-out, upper bound on input). Referred to in prose as the signed execution floor because it is the worst-case settlement the user has authorized. | User-relevant token |
| tolerance | Proportional slippage tolerance, defined symmetrically (§A.2). | Basis points |
budget_consumed | Fraction of the user's signed tolerance the realized settlement consumed (§A.3). 1 = at the boundary, 0 = no impact, < 0 = user did better than V₀. | Dimensionless |
g | Per-swap signed USD execution gap (§A.4). Negative = user shortfall, positive = user gain. Matches the CSV total_gap_usd. | USD |
| execution shortfall | User-side dollar magnitude when execution is adverse: max(0, −g). | USD |
A.6 Cohort vocabulary
The article uses a small set of cohort and range labels in addition to formal notation.
| Label | Definition |
|---|---|
| Full analyzed cohort | n = 332 swaps. All public-mempool, direct Uniswap V3, ≥$50 000 USD notional Ethereum swaps over 2026-02-13 → 2026-05-13 that survived the decoder, simulation, receipt-parser, and pricing pipeline with a decodable signed boundary. The broad denominator. |
| Default-tolerance subcohort | n = 286. Full analyzed cohort restricted to tolerance ≤ 200 bps. The headline denominator throughout the article. |
| Loose-tolerance subcohort | n = 46. Full analyzed cohort restricted to tolerance > 200 bps. |
| Tolerance ranges | Cohort partition by tolerance. Default-tolerance range: tolerance ≤ 200 bps. Loose-tolerance range: tolerance > 200 bps. The default-tolerance range corresponds to the tolerance band commonly used across consumer-facing transaction interfaces and wallet software. Definition in Section 4.6. |
| at-floor | Prose label for budget_consumed ≥ 0.99. |
| near-floor | Prose label for budget_consumed ≥ 0.95. |
Every table in the article reprints the relevant threshold inline for the colloquial labels.
Appendix B: Flagged pair inventory and unusual-activity context
This appendix contains the supporting material for Section 4.8: the full 32-pair volume inventory, the flagged-pair peak dates, the cohort-swap inclusion-date distribution, and descriptive notes on each flagged pair. All event-context notes are descriptive and contextual only; they do not imply causal attribution.
The full 90-day per-day volume series for each pair is published at reports/articles/03-the-execution-gap-on-uniswap-v3/pair-volume-90d.json and is regenerable from cli/v3-pool-volume-90d.ts.
Table B.1: Per-pair daily volume across the 90-day window, sorted by max/median ratio (descending). All 32 pairs that any cohort swap touched are listed. The "Max / Median" column is the diagnostic for transient activity periods; values much larger than 1 indicate a pair where the typical day is much quieter than the busiest day. The five bolded rows satisfy both flagging conditions defined in Section 4.8.
| Pair | Median ($/day) | Mean ($/day) | P90 ($/day) | Max ($/day) | Max / Median | Days with data |
|---|---|---|---|---|---|---|
| aWETH / WETH | $29 | $10.6M | $7.0M | $301M | ~1.0 × 10⁷ | 86/90 |
| lsETH / WETH | $3.8k | $67.5k | $30.9k | $4.2M | ~1.1 × 10³ | 76/90 |
| FIDD / USDT | $36.2k | $200k | $231k | $5.9M | ~1.6 × 10² | 76/90 |
| WBTC / solvBTC | $41.7k | $169k | $215k | $6.4M | ~1.5 × 10² | 89/90 |
| FIDD / USDC | $35.8k | $127k | $210k | $4.0M | ~1.1 × 10² | 84/90 |
| AAVE / WETH | $774k | $2.2M | $2.9M | $74.6M | 96.4 | 90/90 |
| mETH / cmETH | $2.0k | $15.7k | $68.4k | $143k | 70.7 | 46/90 |
| stETH / WETH | $23.0k | $69.6k | $156k | $1.05M | 45.9 | 90/90 |
| USDT / USDf | $180k | $409k | $873k | $6.3M | 35.0 | 90/90 |
| WM / USDC | $916k | $3.2M | $9.3M | $30.9M | 33.7 | 88/90 |
| USD0 / USDC | $188k | $437k | $1.2M | $5.6M | 29.9 | 90/90 |
| WETH / weETH | $7.4M | $14.8M | $36.3M | $162M | 22.0 | 90/90 |
| RLUSD / USDC | $11.2M | $19.9M | $45.8M | $214M | 19.1 | 90/90 |
| 0x5f78… / USDC | $234k | $331k | $673k | $3.0M | 12.6 | 90/90 |
| DAI / USDC | $2.1M | $3.5M | $7.9M | $25.1M | 12.1 | 90/90 |
| tBTC / WBTC | $3.7M | $4.7M | $9.0M | $43.6M | 11.9 | 90/90 |
| USDC / fTUSD | $30k | $57k | $201k | $315k | 10.7 | 17/90 |
| EURC / 0x5f78… | $375k | $629k | $1.6M | $3.5M | 9.3 | 90/90 |
| AUSD / USDC | $2.9M | $4.1M | $9.3M | $23.5M | 8.0 | 90/90 |
| wstETH / WETH | $14.4M | $20.3M | $53.7M | $102M | 7.0 | 90/90 |
| DAI / USDT | $12.5M | $15.0M | $29.1M | $64.9M | 5.2 | 90/90 |
| XAUt / USDT | $9.2M | $10.6M | $19.3M | $44.6M | 4.9 | 90/90 |
| WBTC / USDC | $8.5M | $9.8M | $16.1M | $33.3M | 3.9 | 90/90 |
| EURC / USDC | $3.8M | $4.4M | $9.0M | $13.8M | 3.7 | 90/90 |
| WBTC / cbBTC | $28.8M | $30.6M | $57.0M | $95.7M | 3.3 | 90/90 |
| WBTC / WETH | $32.0M | $35.4M | $58.4M | $103M | 3.2 | 90/90 |
| WETH / SPX | $906k | $932k | $1.6M | $2.8M | 3.1 | 90/90 |
| WBTC / USDT | $29.9M | $32.0M | $53.5M | $88.5M | 3.0 | 90/90 |
| USDC / WETH | $197M | $218M | $356M | $570M | 2.9 | 90/90 |
| WETH / USDT | $109M | $111M | $179M | $268M | 2.5 | 90/90 |
| USDC / USDT | $648M | $673M | $1.02B | $1.51B | 2.3 | 90/90 |
| USDC / VOL | $85k | $42k | $85k | $85k | 1.0 | 2/90 |
The next-nearest non-flagged pair (AAVE / WETH at max/median = 96.4) falls below the 100× threshold, giving the classification a visible separation in this cohort.
Table B.2: Peak-volume dates for the five flagged pairs.
| Pair | Median ($/day) | Peak volume | Peak date | Top-3 peak window |
|---|---|---|---|---|
| aWETH / WETH | $29 | $301M | 2026-04-20 | 2026-04-19 → 2026-04-21 |
| lsETH / WETH | $3.8k | $4.2M | 2026-03-11 | single date |
| FIDD / USDT | $36k | $5.9M | 2026-04-16 | 2026-04-14, 2026-04-16 |
| WBTC / solvBTC | $42k | $6.4M | 2026-03-05 | 2026-02-25, 2026-03-05, 2026-03-23 |
| FIDD / USDC | $36k | $4.0M | 2026-04-14 | 2026-04-14, 2026-04-16 |
Table B.3: Inclusion-date distribution of the 48 flagged-pair-touching swaps.
| Date | Cohort swaps touching flagged pairs |
|---|---|
| 2026-02-24 | 1 |
| 2026-03-11 | 3 |
| 2026-04-14 | 1 |
| 2026-04-16 | 5 |
| 2026-04-19 | 15 |
| 2026-04-20 | 3 |
| 2026-04-21 | 9 |
| 2026-04-22 | 5 |
| 2026-04-23 | 6 |
| Total | 48 |
The 2026-04-19 → 2026-04-23 cluster contributes 38 of the 48; the rest are smaller bursts on other dates, distributed across the four non-aWETH flagged pairs.
Table B.4: Per-flagged-pair inventory with descriptive notes. "Cohort swaps" is the count of cohort swaps that include the pair in any leg of the route (so multi-hop swaps with a flagged intermediate are included). Peak date is the single date with maximum daily volume across the 90-day window; the broader event window in some cases spans several consecutive days.
| Pair | Token A address | Token B address | Median daily volume | Peak daily volume | Peak date | Cohort swaps | Note |
|---|---|---|---|---|---|---|---|
| aWETH / WETH | 0x4d5f47fa…d3a6ef8e3c9bc514e8 | 0xc02aaa39…c4f27ead9083c756cc2 | $29 | $301.21M | 2026-04-20 (peak), 2026-04-19 → 2026-04-21 (window) | 38 | Aave V3 lending-receipt token paired against WETH. Activity window coincides in time with publicly discussed Kelp DAO–related activity and Aave V3 collateral dynamics. The pair's typical (median) day is single-digit dollars; the event-window peak is roughly seven orders of magnitude above baseline. |
| lsETH / WETH | 0x8c1bed5b…1da1d7bd5e10b6549 | 0xc02aaa39…c4f27ead9083c756cc2 | $3.8k | $4.16M | 2026-03-11 | 3 | Liquid-staking ETH derivative paired against WETH. Single-day activity burst with no separately-attributable incident identified at the time of writing. |
| FIDD / USDT | 0x7c135549…99fa5ebabb8e35d | 0xdac17f95…6206994597c13d831ec7 | $36.2k | $5.91M | 2026-04-16 | 3 | Long-tail issuance pair against USDT; two-day activity burst (2026-04-14 and 2026-04-16). No separately-attributable incident identified. |
| FIDD / USDC | 0x7c135549…99fa5ebabb8e35d | 0xa0b86991…d4a2e9eb0ce3606eb48 | $35.8k | $3.97M | 2026-04-14 | 3 | Same FIDD asset paired against USDC; same two-day activity period as the FIDD/USDT row above. |
| WBTC / solvBTC | 0x2260fac5…fbcfedf7c193bc2c599 | 0x7a56e1c5…2a1832b028f0456652f97 | $41.7k | $6.38M | 2026-03-05 | 1 | Wrapped-BTC paired against solvBTC (a restaked / bridge-derivative BTC). Multi-date bursts visible (2026-02-25, 2026-03-05, 2026-03-23); no separately-attributable incident identified. |
Three observations follow from the table:
- Four of the five pairs involve receipt tokens, liquid-staking derivatives, or wrapped/bridged-BTC variants. Each of these asset classes has its own external-state dependency (Aave lending index, ETH-staking exit queue, BTC-bridge issuance) that can produce activity unrelated to ordinary AMM order flow.
- The cohort-swap counts are concentrated. 38 of the 48 cohort swaps touching flagged pairs (79.2%) touch the aWETH/WETH pair. The remaining four pairs jointly contribute 10 swaps.
- Peak dates do not cluster on a single calendar day. Burst dates span 2026-02-25 through 2026-04-23, so the unusual-activity pattern is not a single market event but a small set of independent activity shifts within the 90-day window.
The aWETH/WETH activity window coincides in time with publicly discussed Kelp DAO–related activity and Aave V3 collateral dynamics. The flagging criterion itself relies only on observed pair-volume behavior. During such events, some arbitrage activity may route through private order flow, including searcher bundles, builder-private orderflow channels, or RFQ-style fills. Such activity would not necessarily be visible in the Flashbots Mempool Dumpster used for the public-mempool inclusion criterion in Section 4.1. The cohort swaps we observe therefore represent only the public-mempool slice of the activity around these periods.
For each pair, the full 90-day daily volume series is available in the JSON artifact linked above. Researchers wishing to apply alternative flagging criteria (e.g., different ratio threshold, different median floor, rolling-baseline tests) can recompute from that file without rerunning the upstream Dune query.